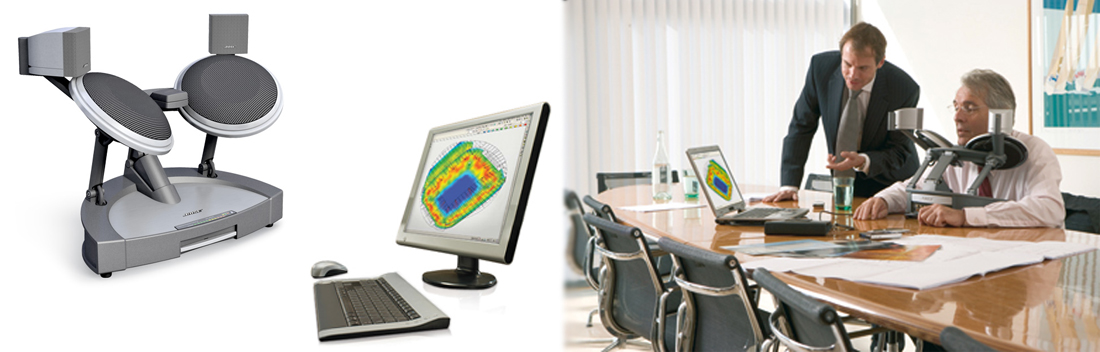
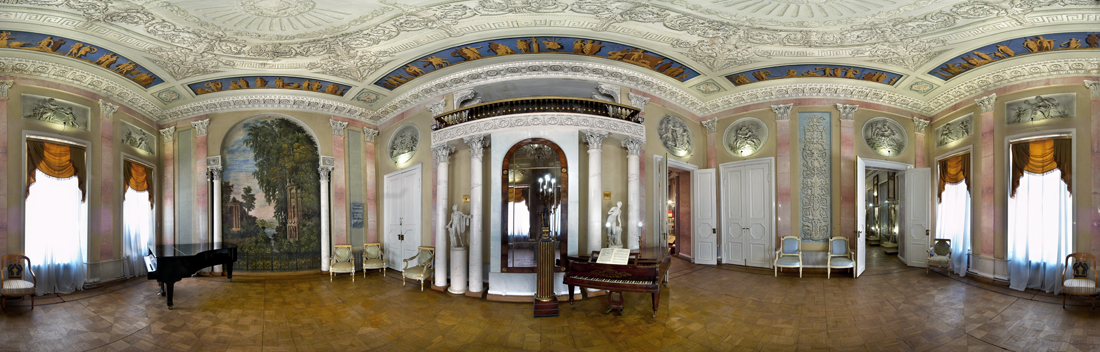
EASE acoustic modelling is used for rooms with complex geometry or demanding music and speech requirements. The model tests architecture, finishes and the sound system before equipment is purchased and installed.

What an EASE calculation can answer
The digital model compares loudspeaker positions, aiming, delays, gain structure and acoustic finishes. It predicts coverage uniformity, available level and speech intelligibility across the audience area. Typical applications include concert, theatre, assembly and conference halls, sports venues, houses of worship, clubs and multipurpose spaces. Separate operating scenarios can be modelled for conferences, concerts and presentations.3D geometry and material data
The process starts with a three-dimensional model of the room or outdoor area. Walls, ceiling, floor, stage, balconies and major objects are represented as planes with assigned absorption and reflection data. Values come from software libraries, manufacturers’ documentation or measurements. For existing rooms the model is refined using the actual finishes and on-site acoustic data.

Loudspeaker selection and placement
Once the room response is understood, loudspeakers are added using verified manufacturer data such as directivity, sensitivity, power handling and frequency response. The engineer compares mounting points, height, aiming, delay and zoning. Where coverage is uneven, the loudspeaker type, position or orientation is revised.
Direct and reflected sound
Direct sound-pressure level shows which seats receive sufficient energy directly from the loudspeakers. Coverage maps are produced for relevant frequency ranges and the working bandwidth. Reflected energy is then included. Comparing direct and reflected sound identifies areas where reflections may reduce clarity and estimates the maximum useful operating level.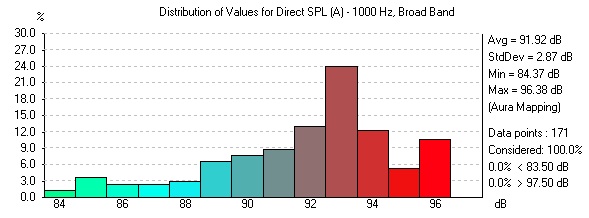
Speech intelligibility and quality indicators
Reverberation, room geometry and loudspeaker data are combined to estimate speech intelligibility. Critical projects are supplemented by measurements and a verification method agreed for the project. Direct-to-reverberant ratio, clarity, early and late reflections and other indicators are also reviewed. No single graph is sufficient; the design is assessed as a complete engineering system.
Project deliverables
- 3D room model and modelling assumptions;
- reverberation-time calculation and finish recommendations;
- sound-pressure and speech-intelligibility maps;
- loudspeaker location and aiming plan;
- recommendations for amplification, processing and zoning;
- technical report for design documentation.